Platform iTrader 7.5 + iTrader Mobile Ver.
1. Order of installation and uninstallation of the terminal "iTrader" to the user's computer
1) Download the distribution file from the web-site of the Company
www.angmarkets.com
2) Save the distribution file (iTrader.exe) in any directory
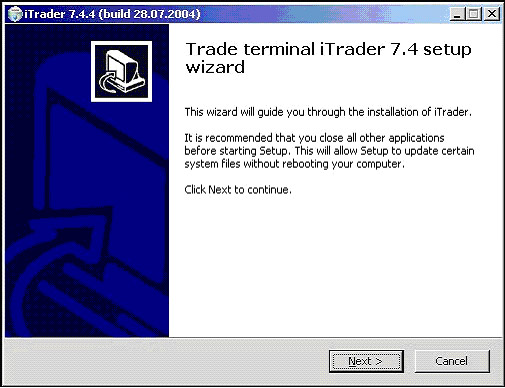
3) For installation of the software open the distribution file (for example through "Explorer"). In the window of the installation guide that appears click "Next" (picture 1.1.)
Picture 1.1.
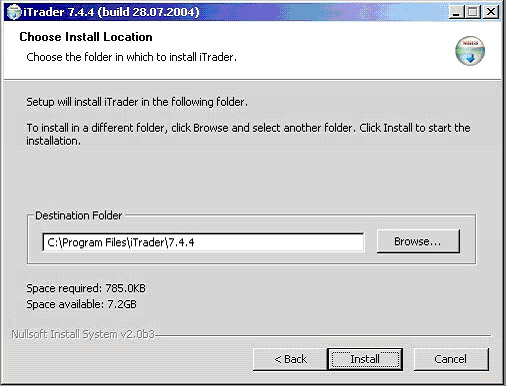
4) Choose the path, where the trading terminal should be installed and press "Install". By default the terminal will be installed to the folder C:\Program Files\iTrader\7.5 (picture 1.2.).
Picture 1.2.
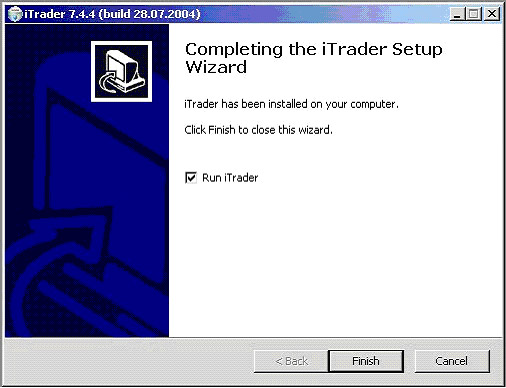
During the installation two shortcuts will appear as well as program group "iTrader" in the menu "Start - Programs. For operations with demo-account use the shortcut called "iTrader 7.5 (demo)". For finishing the installation press "Finish" (picture 1.3.)
Picture 1.3.
5) For removing the TT (trading terminal) from your
computer choose item "Replace/Remove" from the menu
"Start -> Settings -> Control panel -> Add/Remove
programs - iTrader."
2. Working with the trading terminal iTrader 7.5
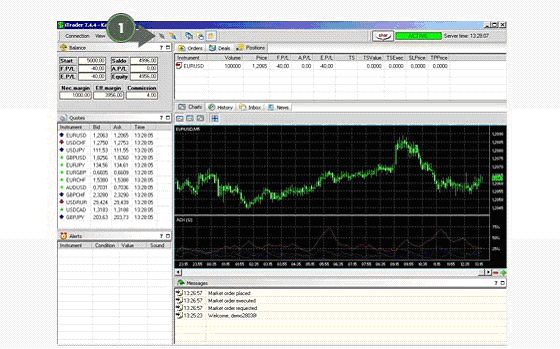
Picture 2.
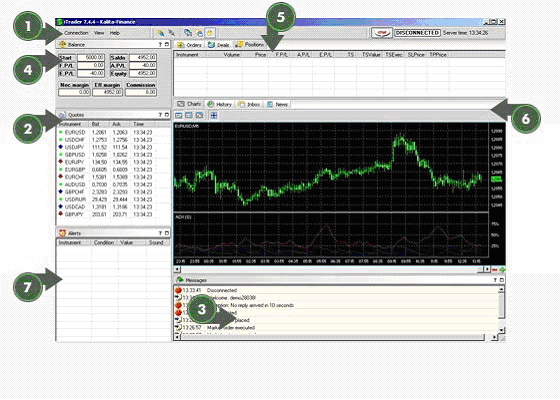
In picture 2 you can see the general view of the trading terminal. It consists of the following elements:
(1) the control panel and the status line
(2) the quotations window
(3) the system messages window
(4) the account balance window (Account statement)
(5) the window of open positions, orders and deals for the current trade session
(6) the window of charts, reports for executed deals for a certain period (History), incoming messages from the dealer and financial news
(7) the window of sound alerts
2.1. User's interface: description and function
of windows
Switch on the trading terminal “iTrader” using the
shortcut on your Windows desktop
2) If you work in the Internet through direct connection (by modem) - for connection and entering the trading system after opening the terminal window press the key "Connect to the server" in the Control panel of the terminal (position 1 in picture 3) Those users, who connect to the Internet through a proxy-server, should make additional settings (see section "Connection through a proxy server")
Picture 3.
In the window that appears enter your User Name and a password. If you want to open a demo-account (virtual account), press the key "Demo" and fill in the address of your e-mail. The user name and the password for your demo-account will be sent there. In order to activate the key "Demo" the fields "User Name" and "Password" should be empty (picture 4).
Picture 4.
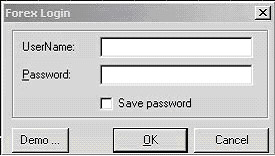
For saving the username and the password insert a tick near "Save password". In this case you won't have to enter you account information next time you connect to the trading platform.
Attention: We strongly recommend erasing this information when using computers that can be accessed by other users (for example in an Internet-cafe). We are not responsible for the damage incurred in case a third person has access to your trading account.
2.1.1. Control panel of the trading terminal "iTrader"
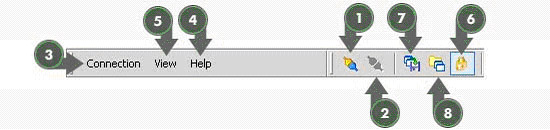
Control panel (pictures 5 and 6) is necessary for connecting/disconnecting
of the trading terminal and the server, making different settings,
receiving information of the current version of the terminal.
Picture 5. Control panel before connecting to the server.
Picture 6. Control panel after connecting to the server.
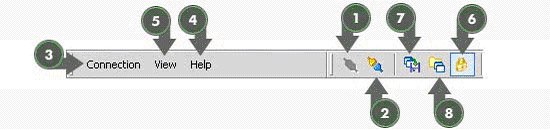
(1) The key "Connect to the server" - establishes the connection of the terminal to the server.
(2) key "Disconnect from the server" - breaks the connection to the server.
(6) The key "Freeze" - for fixing/releasing windows of the trading terminal (item "Freeze")
(7) The key "Save layout" - for saving current position of windows of the trading terminal
(8) The key "Open layout" - for opening previously saved position of windows of the trading terminal
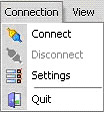
(3) The menu "Connection" (picture 6.1.) - is used for connecting/disconnecting from the server, making settings of the connection, changing the language, receiving reports of the deals by e-mail, exporting the data to programs of technical analysis.
Picture 6.1.
(4) The key "Information" - shows the information of the current version of the trading terminal
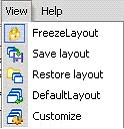
(5) The key "View" (picture 6.2) - is used for setting the parameters of the user's interface, fixing or releasing windows of the trading terminal (item "Freeze")
Picture 6.2.
When using free position of the windows the keys for switching on/off the windows are activated in the control panel (picture 6.3.)
Picture 6.3.
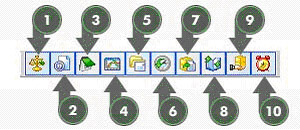
1 - switch on/off the balance window
2 - switch on/off the quotations window
3 - switch on/off the system messages window
4 - switch on/off the chart window
5 - switch on/off the incoming messages window
6 - switch on/off the window of the history of orders, deals, operations
7 - switch on/off the order window
8 - switch on/off the deals window
9 - switch on/off the positions window
10 - switch on/off the sound alerts window
The user may leave necessary windows and place them in the necessary order. When Ctrl-key is pressed one can combine windows, dragging them to each other by the mouse. They can be combined into a single window (picture 6.4) or have bookmarks (picture 6.5.)
Picture 6.4. Combination of two windows into a
single one
Picture 6.5. Combination of two windows on the
basis of bookmarks
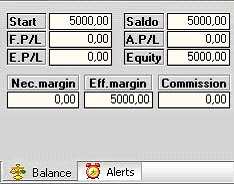
2.1.2. Account balance window
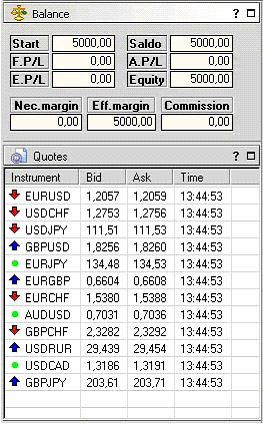
The appearance of this window is shown in picture 7:
Picture 7.
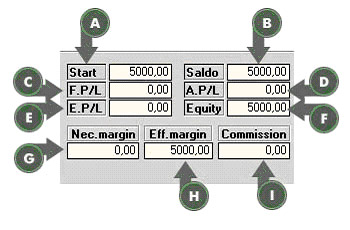
(a) the cell "Start" shows the total amount of money at the beginning of the current trading session
(b) the cell "Saldo" shows the amount of money at the client's account after placing to the account/withdrawing from the account the money and with the fixed profit/loss and paid commission. For example, at the beginning of the trading session total amount of the client's account was 5000 USD, fixed profit (A.P/L) was 500 USD and paid commission was 8 USD. In this case the sum in the cell "Saldo" will be the following: 5000+500-8=5492 USD.
(c) the cell F.P/L shows the amount of floating variable margin (in other words - current profit or loss for open positions. This amount is recalculated each time the quotations change. In other words, one can see the volume of profit/loss for currently open positions in case of their closing at current exchange rates.
(d) the cell A.P/L shows the amount of fixed profit/loss for closed positions
(e) the cell E.P/L shows the sum of F.P/L+ A.P/L.
(f) the cell Equity shows the amount of money taking into account the variable margin, received for the current trading session. Equity = Saldo + E.P/L. This sum shows how much money will remain at the account if a client closes all his position at current exchange rates.
(g) the cell Nec. Margin shows the amount of money, used for opening positions.
(h) the cell Eff. Margin shows the amount of money not used for maintaining current positions. These money may be used for opening new positions Eff.margin = Equity - Nec.margin.
(i) the cell Comission shows the sum of commission fees, paid during current trading session.
2.1.3 Quotations window
The quotations window (picture 8) is used for showing current
levels for buying (ASK) and selling (BID) a certain lot of any
of 11 available financial instruments, placing orders for making
deals choosing the time interval and outputting charts for different
currencies.
Picture 8.
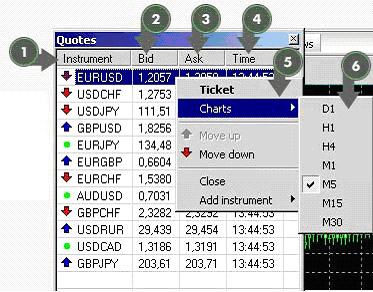
?The quotations window consists of 4 columns: Instrument, Bid, Ask, Time
1) Column "Instrument". Shows financial instruments, available for trading. By default there are 4 major instruments, with the help of the menu "Close/Add instrument" one can choose any combination of available financial instruments.
2) Column "Bid" shows current prices for selling financial instruments.
3) Column "Ask" shows current prices for buying financial instruments.
4) Column "Time" shows the time of the last change in the quotations of an instrument
The quotations window may be vertically adjusted. One can change the size of this window by dragging the lover border of this window up or down.
Information for each financial instrument is marked with the blue color after single click on it by the left mouse key. When clicked twice it opens the order window for the instrument under the cursor.
After a single click on the instrument by the right mouse key the special menu appears (item 5 in picture 8). With its help one can place an order for making a deal, open a chart for this instrument with required time interval, move the instrument up or down in the quotations window and to show or close the instrument in the quotations window.
2.1.4. Sound alerts window
This window is used for placing sound alerts (picture 8.1.). Sound
alerts inform the trader of reaching a certain price level by
the rate of a chosen financial instrument.
Picture 8.1.
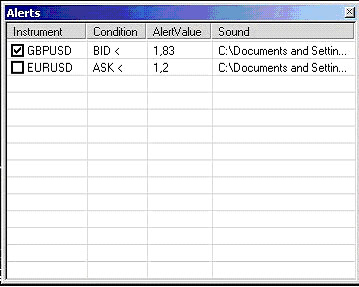
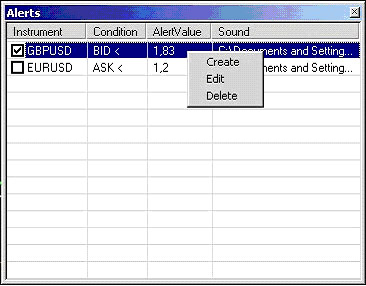
For editing the list of alerts in the window "Alerts" (picture 8.2.) click by the right mouse key on the window (for adding new alert) or on an existing alert (for editing). For activating/deactivating a certain alert put/remove a mark against this alert.
Picture 8.2.
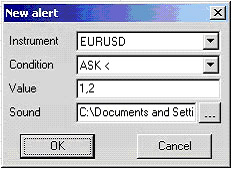
When adding/editing the alert condition one should fill in all necessary parameters in the opening window (Instrument, Condition, Value, Sound) - picture 8.3.
Picture 8.3.
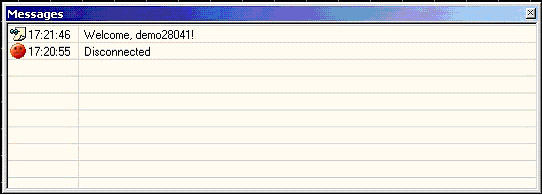
2.1.5. Messages window
This window is used for informing the user of the process of placing
his orders, making deals, connection/disconnection etc. (picture
9).
Picture 9.
2.1.6. Status line
The status line is used as an indicator of the state of the trading
session, system time and connection "terminal-server"
(picture 10).
Picture 10.
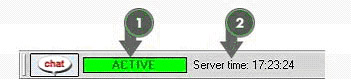
1) The state of the trading session and the connection "terminal-server". This indicator has four possible positions: ACTIVE (trading session is opened), PAUSED (trading session is paused), CLOSED (trading session is closed), DISCONNECTED (connection with the server is broken).
The Active status is possible only when the user is connected to the Internet.
On very rare occasions the trading session may be paused (for example, for conducting some works on the server) - as a rule we inform our clients beforehand. When the trading session is closed or paused, deals cannot be made.
2) System time and date. Here you can see the time of the trading system.
2.1.7. The window of open positions
This window is used for showing the open positions for the current
trading session. The appearance of this window you can see in
picture 11:
Picture 11.
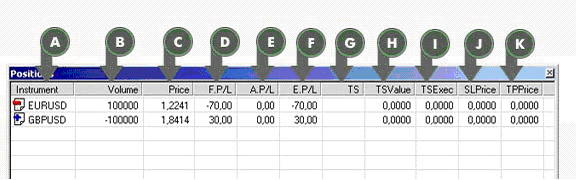
(a) the column "Instrument" shows the financial instrument with open positions
(b) the column "Volume" shows the aggregate volume of lots for this financial instrument. If the volume is positive, it means that there is "long" position (buying). If the volume is negative, it means that there is "short" position (selling).
(c) the column "Price" shows the average price for the lots of this financial instrument. For example, if one bought 100.000 EUR/USD at the price 0,99 and 300.000 at the price 0,98, the average price will be 0,9825
(d) the column F.P/L shows the amount of floating profit/loss for the client's open positions. This amount is recalculated after every change in the quotes. In other words, it shows the current profit/loss for open positions in case of their closing at current exchange rates. Attention: in this window the floating profit/loss are shown in the quotation currency. For example, if a position of USD/CHF is opened, floating profit/loss will be shown in Swiss francs. After closing this position this financial result will be recalculated into dollars at the exchange rate at the moment of closing the position.
(e) the column A.P/L shows the amount of profit/loss for closed positions (i.e. the amount of received profit/incurred loss for already closed positions)
(f) the column E.P/L shows the sum F.P/L+ A.P/L
(g) the column TS shows the step of trailing stop if trailing stop is placed for this position. Step - is the number of points for price movement when the trailing stop will move following the price.
(h) the column TSValue shows the original price of placing trailing stop.
(i) the column TSExec shows the price at which the trailing stop will be executed and the position will be closed.
(j) and (k) these columns show the values of stop-loss and take-profit orders, connected to this open position
Placing trailing stop orders
Trailing stop order is a type a limit order, where the price automatically changes in accordance with a certain condition after changes in exchange rate of the financial instrument. Trailing stop orders are designated in the terminal with symbol "TS" (trailing stop)
For placing trailing stop order:
1. Open the bookmark "Positions"
2. Click with the right mouse key on an open position and in the window that appears choose Trailing stop and conditions for executing and changing the order.
For example, let's take 20 points. The result you can see in the picture.
The column TS shows 20, the columns TSValue and TSExec contain the prices.
TSValue shows the price when this order was placed. In this case the order was placed at the price of 1,8433.
The column TSExec shows the price when this order will be executed and the position will be closed. In this case the position will be executed at ASK=1,8453.
If the price goes down and ASK becomes less than 1,8413 the values of TSValue and TSExec change in accordance with the price movement with the step of 20 points. If the price goes up the values don't change.
For canceling the trailing stop click on the open position with the right mouse key, choose in the menu that appears "trailing stop" and put the mark against "None".
The advantage of these orders is that they fix the level of losses (as a client fixes the maximum level of losses in points when placing this order) and profits increase (when the price goes in favorable direction, the price of this order moves for increasing the profitable level of closing the position). And if the price reverses and goes back a client won't loose his profit since trailing stop will fix the profit.
Attention: this type of limit order will completely close the open position.
?Binding Stop-Loss and Take-Profit orders to the open position
For binding SL and TP orders to the open position you should do the following:
1. Click on the open position with the right mouse key and choose SLTPorder in the menu that appears
2. In corresponding lines enter necessary price levels
Order Stop-Loss fixes losses and order Take-Profit fixes profits, so when you have long position (buying), the price of stop-loss should be lower than the price of opening the position, and the level of Take-Profit should be higher than the price of opening the position. For short position (selling) the other way round.
For modifying the SL and TP orders repeat steps 1 and 2
2.1.8. The window of orders for the current session
Picture 12.
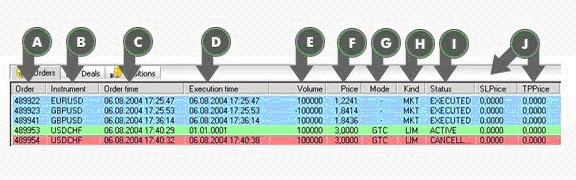
(?) the column "Order" shows the number of each order, awarded by the trading system.
(b) the column "Instrument" shows the financial instrument, for which the order was placed.
(c) the column "Order time" shows the date and time of placing the order in the trading system.
(d) the column "Execution time" shows the time of execution of placed orders, i.e. the time of making deals. If this column shows the time of execution "01.01.0001", it means that the order hasn't been executed.
(e) the column "Volume" shows the number of lots of the financial instrument in the order
(f) the column "Price" shows the price of the financial instrument in the placed orders
(g) the column "Mode" shows the mode for limit-orders (market orders have dash instead of it). "GTC" mode - these orders stay active till the moment of their execution or cancellation. "Day" mode - these orders stay active till the end of the trading session and then automatically canceled.
(h) the column "Kind" shows the type of the order: MKT (market) or LIM (limit)
(i) the column "Status" shows the status of each order: ACTIVE (active limit-order), EXECUTED (executed order), CANCELLED (cancelled order).
(j) the columns SLPrice and TPPrice show the prices of orders SL and TP, bound to the active limit-order.
For more illustrative representation of order status the trading terminal has the following color scheme: executed orders are blue, active (limit) orders are green, cancelled orders are red.
Cancellation of an active limit-order
The process of cancellation is shown in picture
13:
Picture 13.
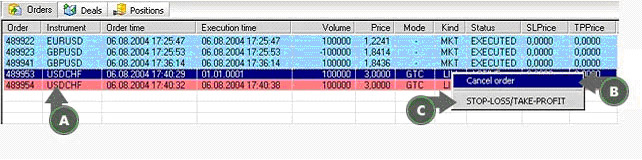
For canceling the limit order click on this order in "Orders window" with the left mouse key. All the line of this order will be marked out (a). After it click the right mouse and a menu with option "Cancel order" will appear (b). For cancellation click on it with the left mouse key and the order will be cancelled and shown in red.
Binding Stop-Loss and Take-Profit orders to active limit-orders
This version of the software provides you the possibility of binding stop-loss and take profit orders to active limit orders.
The procedure is the following:
1) Click on the active limit-order with the right mouse key and choose SLTPorder from the menu that appears
2) Enter necessary levels in corresponding lines (picture 14)
Picture 14.
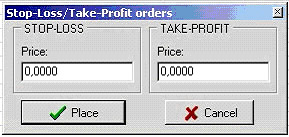
Order Stop-Loss fixes losses and order Take-Profit fixes profits, so when you have long position (buying), the price of stop-loss should be lower than the price of opening the position, and the level of
Take-Profit should be higher than the price of opening the position. For short position (selling) the other way round.
For modifying the SL and TP orders repeat steps 1 and 2
You should also remember the following:
- when the limit order is cancelled orders SL and TP are cancelled automatically.
- If the active limit-order with placed SL and TP closed a position, orders SL and TP are automatically canceled.
2.1.9 The window of deals for the current session
The appearance of this window is shown in picture 15:
Picture 15.
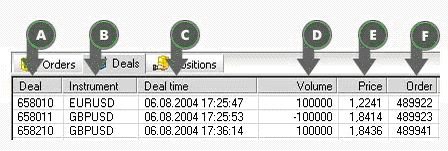
This window shows the deals, made for the current session
(a) the column "Deal" shows the number of the deal assigned by the system
(b) the column "Instrument" shows the financial instruments, which were traded.
(c) the column "Time" shows the date and time of making the deal
(d) the column "Volume" shows the quantity of lots of each financial instrument in the deal.
(e) the column "Price" shows the price of the deal.
(f) the column "Order" shows the number of the order for making this deal. The deals, connected with rolling positions over to the next trading session and automatic closing positions (due to the lack of margin), have the following numbers:
- rolling over positions: "-1" and "-2"
- automatic closing: "-3"
2.1.10. The charts window
The appearance of this window is shown in picture 16:
Picture 16.
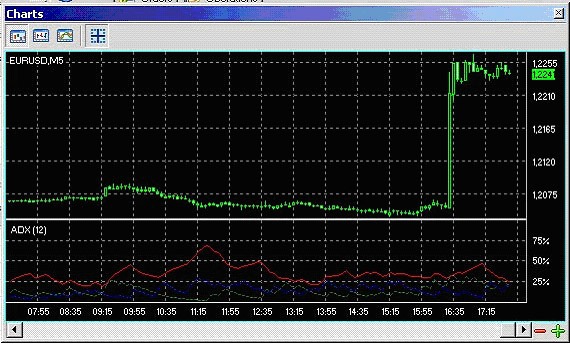
For opening a chart window for a certain instrument click on this instrument in the quotations window with the right mouse key and in the menu that appears choose the item "Charts". In the list of time intervals put a mark against the required interval and the chart will be loaded into the chart window. Several instruments of several time intervals for one instrument may be opened. Charts of chosen instruments will be opened in different windows. For closing a certain window click on the chart field with the right mouse key and select the item "Close". Another way of closing a chart is to remove the mark against this time interval in the menu of a particular instrument. For analyzing the chart for previous period use the scrolling line. For changing the scale of the chart use keys "+" and "-" in the right corner.
For changing the form of the chart, drawing lines and technical indicators, exporting data and printing the chart click on the chart field with the right mouse key and the chart menu will appear (picture 17)
Picture 17.
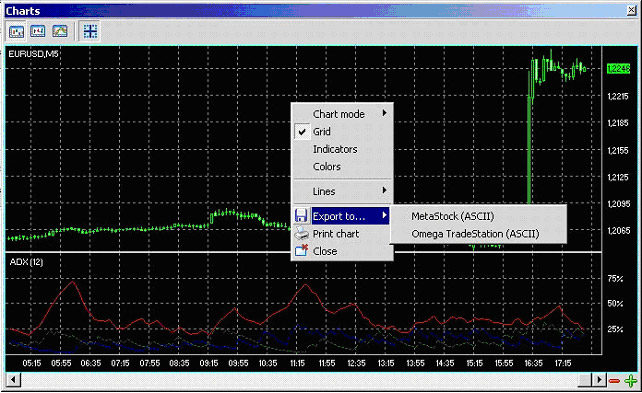
For placing/removing the grid - put or remove the mark against it.
For changing the form of visual presentation of the chart (lines, bars, candlesticks) choose corresponding form in the menu "Chart mode"
For drawing technical indicators select necessary indicators in item "Indicators"
For changing colors of the chart (lines, grid, figures, etc) select necessary colors in the menu "Colors"
In the menu "Lines" you may draw trend and resistance/support lines
For exporting data to the programs of technical analysis MetaStock and Omega TradeStation select the item "Export to". The program will offer you to save data in a text file with the format, accessible by MetaStock and Omega TradeStation
For printing a necessary chart use the key "Print chart"
2.1.11. The history window (reports for a certain
period)
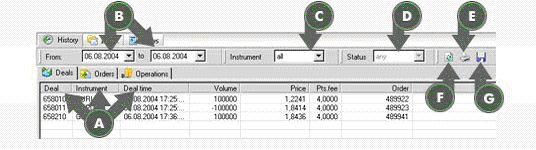
This window is used for analyzing deals, orders, operations, that
took place in previous trading sessions. Its appearance you can
see in picture 18.
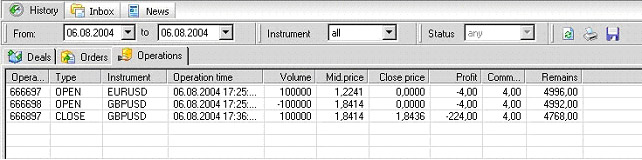
For selecting necessary information (deals, orders, operations) use corresponding labels (a). For selecting necessary period use calendars (b). After selecting the time interval - press the key " Refresh" (f). For selecting a certain instrument use the list "Instrument" (c). For selecting a certain order status (executed, cancelled, active) use the list "Status" (d). For printing the information use the key "Print" (e). For saving the information into a file .CSV (MS Excel format) click on the key "Save the history" (g)
Picture 18.
2.1.12.1. Bookmark "Operations" of the
history window.
The operations cover constant money flow on a client's account, connected with operations of making deals with financial instruments. You can receive the following information
- Number of the operation, assigned by the system
- Type of the operation
- Financial instrument
- Time
- Volume
- Opening and closing price
- Profit/Loss without commission
- Commission
- Remains on the account after completing the operation
Money flows include:
- Writing off the commission
- Fixation of profits
- Fixation of losses
- Depositing money/Returning money
- Swap-operations
Description of operation types
1. OPEN - opening a position
2. CLOSE - closing a position
3. CHANGE - partial closing a position or adding new contracts for already open position
4. LOOSE - automatic closing an open position due to the lack of money in the account.
2.1.12. The window of incoming messages from the
dealer (Incoming)
The appearance of this window is shown in picture 18.1.:
Picture 18.1.
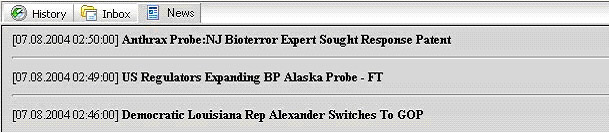
2.1.13. News window
This window shows online financial news in English . The appearance
of this window in shown in picture 18.2.:
Picture 18.2.
2.2. Procedure of placing orders
2.2.1. Procedure of placing market orders
Picture 19.
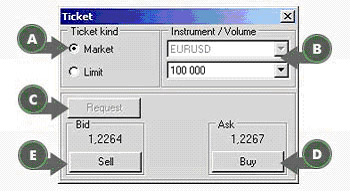
The order window may be shown in three ways:
1. Click twice on the required instrument with the left mouse key
2. Press the key "Order" on the control panel
3. click twice on the open position in the positions window
Put the mark against "Market" (a) (picture 19). In the lines "Instrument/volume" (b) select the necessary instrument (for example EUR/USD) and volume (for example 100.000). After it press the key "Request" (b) You will be given the price in BID/ASK format and the keys "Sell/Buy" will become active. For buying press "Buy" (d), for selling - "Sell" (e). The information about processing the market order will be seen in the message window (picture 9). In case of a change in price at the moment of receipt of your order by the dealer, he may give you another price for your deal. If a new price is given you will see the new price in the order window, the message "New price", the price itself and the offer to buy or to sell at this new price. The messages window will show the corresponding message. If the trader accepts the new price, he should press the key "Yes" within 3 seconds. If the trader rejects the new price he should press the key "No". If the decision is not made within 3 seconds, the order is automatically canceled. The procedure can be seen in the picture.
2.2.2. The procedure of placing limit-orders
The trading terminal provides you with the possibility of placing
simple limit-orders of two types:
Daily (valid till the end of the trading session) and GTC (valid till execution or cancellation)
Picture 20.
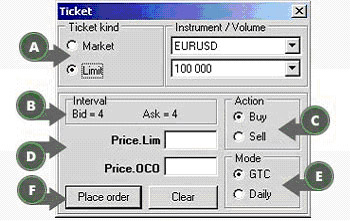
For placing a limit-order mark the circle "Limit" (a) (picture 20) in the order window. For placing a simple limit order enter the price in the field "Price Lim" (d) and select the type of operation - buy/sell (c) and the mode of the order - daily or GTC and press the key "Place order" (f). The order will be passed to the server.
The price of the limit-order for buying must be
higher than the current ASK a certain interval (b). The price
of the limit-order for selling must be lower than the current
BID price a certain interval (b). This interval is given in points.
Otherwise, the limit-order will be automatically cancelled.
3. Trading from mobile device via iTrader mobile
We added the new feature to the DealingOffice software - mobile trading. The special version of iTrader for mobile trading was developed and successfully tested by our specialists. It supports different versions of Pocket PCs.
Internet trading with the use of Pocket PC
DealingOffice software enables its users to trade in financial markets with the use of pocket computers. A special version of the trading platform iTrader was developed for that purpose. iTrader for Pocket PCs works under Microsoft .NET Compact Framework v2.0.
Supported operational systems:
1. Windows Mobile for Pocket PC 2003 (Windows CE 4.2)
2. Windows Mobile 2003 Second Edition (Windows CE 4.2.1)
3. Windows Mobile 5.0.
The software has been successfully tested with the following models of pocket computers:
1. HP iPAQ hx4700
2. Fujitsu-Siemens Pocket LOOX 720
At the present moment iTrader for pocket computers uses the type of Internet connection which is set in your compact computer (GPRS through a mobile phone, Skylink modem, Wi-Fi, etc.)
For installation of iTrader for compact computers you should do the following:
1. Put your Pocket PC into the cradle and connect it to a stationary PC. Synchronize pocket and stationary computers (for example with the use of MS ActiveSync software).
2. Download the version of Microsoft. NET Compact Framework v2.0 (it is possible to download it from http://www.microsoft.com/downloads/details.aspx?familyid=9655156b-356b-4a2c-857c-e62f50ae9a55&displaylang=en )
3. Start the downloaded distributive file from the computer (Compact Framework will be automatically installed into the computer)
4. Download to the personal computer installation file for Pocket PC iTraderDemo.cab
5. Copy with the use of ActiveSync software iTraderDemo.cab to any place on the Pocket PC and start this file - it will automatically install the trading platform (by default into the file Program Files) and remove itself from your computer.
6. Start iTrader for Pocket PCs
Open Account

What We Do
We provide access to global and local financial markets listed below but not limited. Total over 20.000 trading instruments at one platform.
- Forex Spot Trading
- Futures Trading
- Commodities Trading
- Stock Exchange Trading
- Options Trading
- Oil and Gas Trading
- Gold Spot Trading
- Silver Spot Trading
- Globex Market
- Eurex Market
- India Stock Exchange
- Thailand Stock Exchange
- Indonesia Stock Exchange
- Malaysia Stock Exchange
- Japan Stock Exchange
- Singapore Stock Exchange
- Dubai Stock Exchange
- Abu Dhabi Stock Exchange
- Brazil Stock Exchange
- NASDAQ
- NYMEX
Contact details
ANG MARKETS UK Dealing & Trading Office ( London ) London Stock Exchange, 33 Throgmorton Street - London EC2N 2BR, United Kingdom